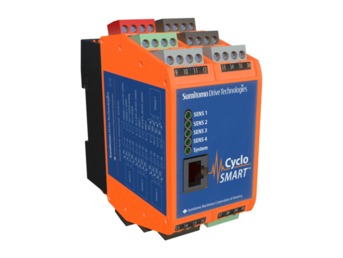
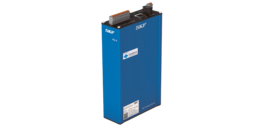
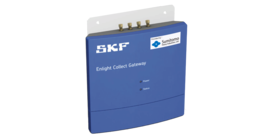
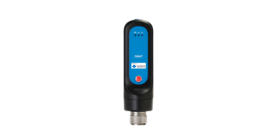
CycloSMART
High-performance model capable of completing everything on-site from diagnostics to data storage
Applications
This product addresses the following needs.
- Managing data in-house for advanced vibration analysis.
| Measurement method | Continuous monitoring | |
|---|---|---|
| Diagnostic method | Vibration (overall value, frequency analysis) | |
| Data management | Detection unit/User's PC | |
| Wireless sensor | Not supported | |
| Explosion-proof sensor | Available | |
| Operating condition | Input speed fluctuation | Available |
| Output load fluctuation | Available | |
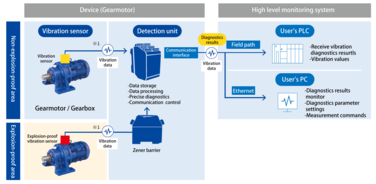
System configuration
Easy to operate with a simple system configuration capable of completing the work on-site.
Measurement data and diagnostics results are managed on your PC.
The system can be used without a PC if it is used only to notify alarms.
*1 The speed and load signals can also be measured.
Features
Monitoring the changes in vibration components of gears, bearings, and other mechanical elements
The trend in vibration components of machine elements can be monitored through frequency analysis with a detection unit.
Monitoring under complex operating conditions
The units can be monitored even if there is a fluctuation in rotation speed or load.
Checking the trend values on-site without permanent installation of PC
Trend values can be displayed on the detection unit even without a PC, making it easy to perform highly accurate diagnostics on-site.
We do the setup that requires technical expertise
We provide support for the necessary setups according to the gear and bearing specifications.
Appropriate implementation support helps you to start a smooth monitoring operation.
Documentation
How to check diagnostic results
The vibration waveforms can be checked in real-time by connecting the detection unit to a PC.
The trend data stored in the detection unit can be downloaded.
| Monitoring items | Vibration acceleration, vibration velocity (overall value, frequency analysis) |
|---|---|
| Devices | PC |
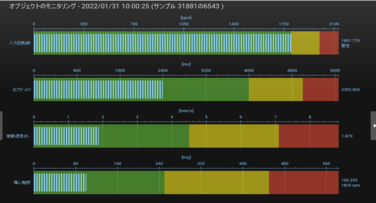
Diagnostics results display
It provides a visual representation of threshold values at the predefined vibration values (overall values and characteristic frequency components) and the current state.
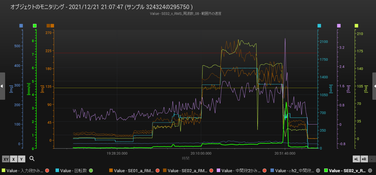
Trend display
Accumulated vibration data can be displayed chronologically for the management of fluctuation trends.
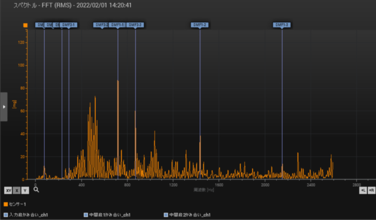
Frequency analysis waveform
The frequency analysis waveform can be displayed. Characteristic frequencies (linked to the speed signal) are automatically highlighted for visual identification.
